Outlook on 2022
For our December 2 Market Pulse webinar, our panel of experts discussed the current and future state of the energy market. This month’s presenters included Sarah Briscoe, Lead Commercial Statistical Analyst at Equifax; Robert Wescott, President and Founder at Keybridge; Sean Holland, Vice President of North America at Just Energy; and Tom Aliff, Risk Consulting Leader at Equifax. Our speakers presented the recent consumer credit trends, small business credit data, an economic update, and the present and future of the energy industry.
Watch a replay of our webinar, “Market Pulse: Powering the Energy Market in 2022” or download a copy of the presentation.
The future
To start, Robert Wescott, President and Founder of Keybridge presented an update on where he sees the economy going in 2022. Where the economy is going is important for energy demand. Other factors to watch will be the inflation outlook, shifts in Chinese growth, and Omicron variant developments. Currently, we are on track for 5.5% growth this year and are projected to have 4% growth in 2022. This growth is being driven by fiscal stimulus measures. Consumers are key and they are feeling happy. However, supply chain and inflation are hurting this growth.
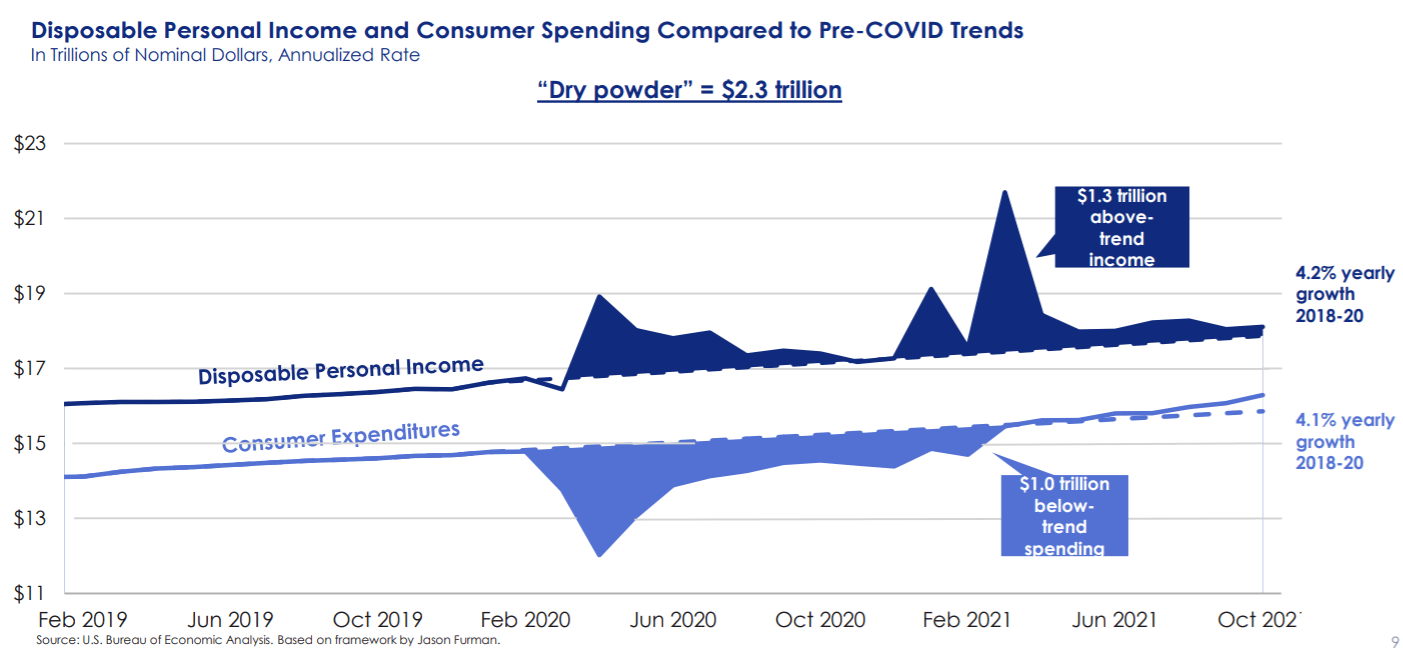
Next, Wescott explained the chart below which shows the disposable personal income and consumer spending compared to COVID-19 trends. Looking at the left half of the top line you can see the trend we have been on for disposable personal income with a 4.2% yearly growth from 2018 to 2020. However, the first building block for the economy is that consumers are on solid ground largely and are sustained by stimulus checks and savings from foregone spending. That being said, they still have $2.2 trillion in “dry powder” to spend. As you can see when COVID-19 hit, it made a large impact. The dry powder is continuing to help drive the economy.
Inflation is the key to knowing the future
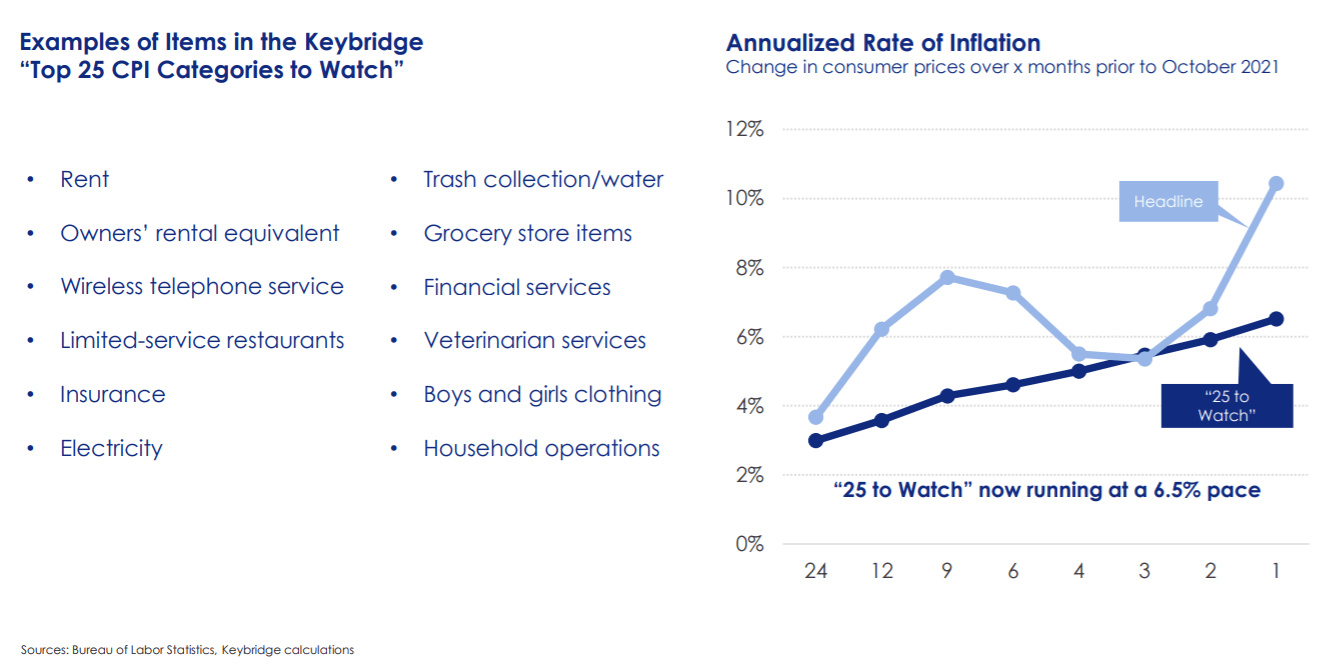
According to Wescott, inflation will be key to understanding where the economy and energy markets are going. To measure inflation risks, Keybridge has developed (examples shown below) a set of the “Top 25 CPI Categories to Watch.” Unfortunately (shown below) when looking at the annual rate of inflation you can see the trend is rising.
Wescott continued by showing the four factors he believes will push inflation up that suggest the federal government may be “behind the curve.” The four factors are:
- Dry powder
- End of disinflation from China
- Rising wages
- Overly stimulative monetary policy
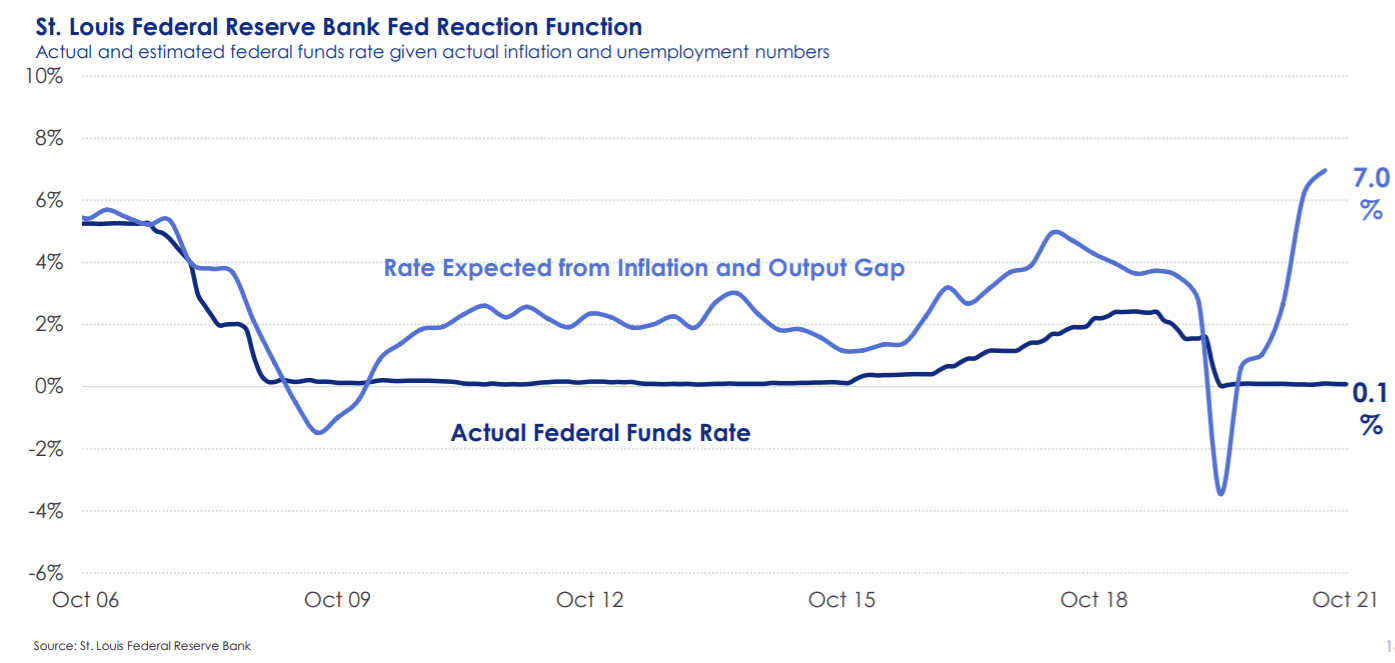
Below, is the fed reaction function which shows what the federal government has actually done based on actual levels of unemployment and inflation. Given current conditions if the Federal Government was true to its own behavior it would be at 7% instead of 0.1%. Three weeks ago everyone thought the Federal Government would not be raising interest rates. Now, only a quarter of financial market players think there will be no rate increases, with half thinking there would be one rate increase by June.
Consumer credit trends
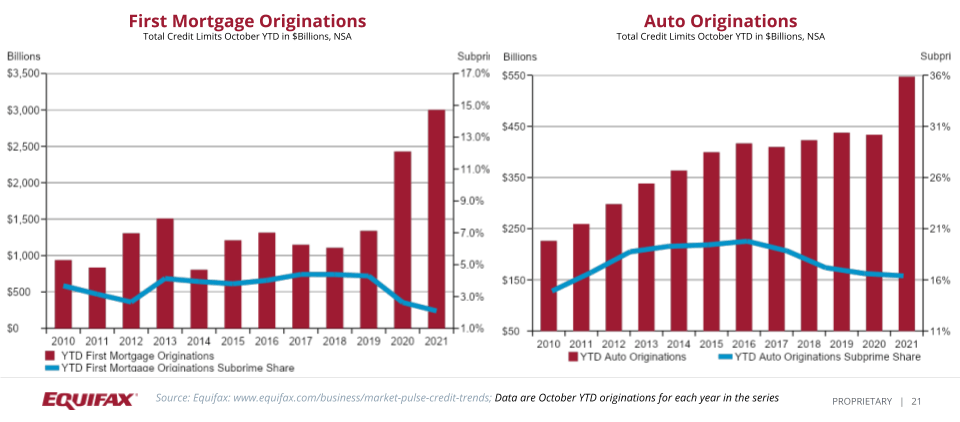
For new credit growth and health, it has been quite a year. The overall market flourished. Mortgage had the strongest year of growth ever in 2020 and beginning of 2021. In 2021, year-to-date first mortgage originations are 19% higher than 2020 (shown below). Auto year-to-date originations are continuing to run at historic highs, and subprime share has dropped from 2018 to 2020 levels (shown below).
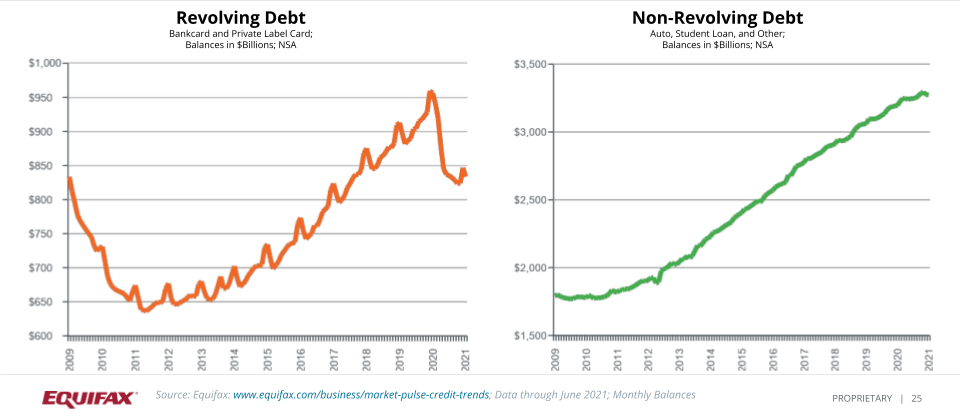
According to Aliff, we have seen 47 million bankcards originated this year to October, which is a 47.5% increase in new accounts this year since 2020. Private label card originations have not yet started the same trajectory for growth, however we do expect these assets to enjoy the greatest growth during the holiday shopping season. Total mortgage consumer debt has increased by $2.5 trillion since March 2013. Aliff stated that non-mortgage debt increased by $1.6 trillion, dropped back in 2020, and is now above pre-pandemic levels.
Car balances had heavy losses in the beginning of the pandemic but are starting to bounce back again. The total non-mortgage debt has risen 66.9% in the last ten years with a single gross trajectory. After growing from 2011-2019, revolving debt dropped $170 billion from the 2019 high, but is continuing to recover slowly. Non-revolving debt has continued to grow buoyed by strong Auto and Alt-Fi lending.
Student loans and disasters
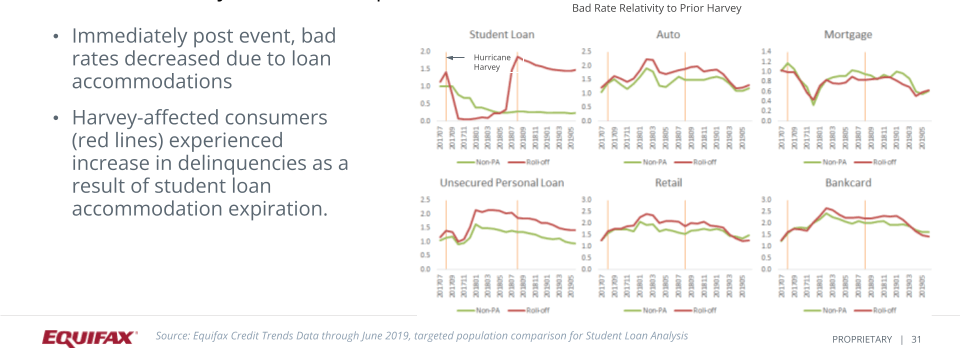
Student loans are expected to come off the administration forbearance at the beginning of next year. As we examine the breakout of student loan debt, we can see that GenZ and Millennials hold the most student loan debt. Currently there is $1.57 billion in student loan balances as of June 2021. Past analysis of natural disasters shows student loan performance increased delinquency rates after coming off of Accomodation. For example, student loan delinquency rates decreased right after Hurricane Harvey, but eventually continued to increase.
For more on student loans, you can download our webinar deck, here.
Small business data and insights
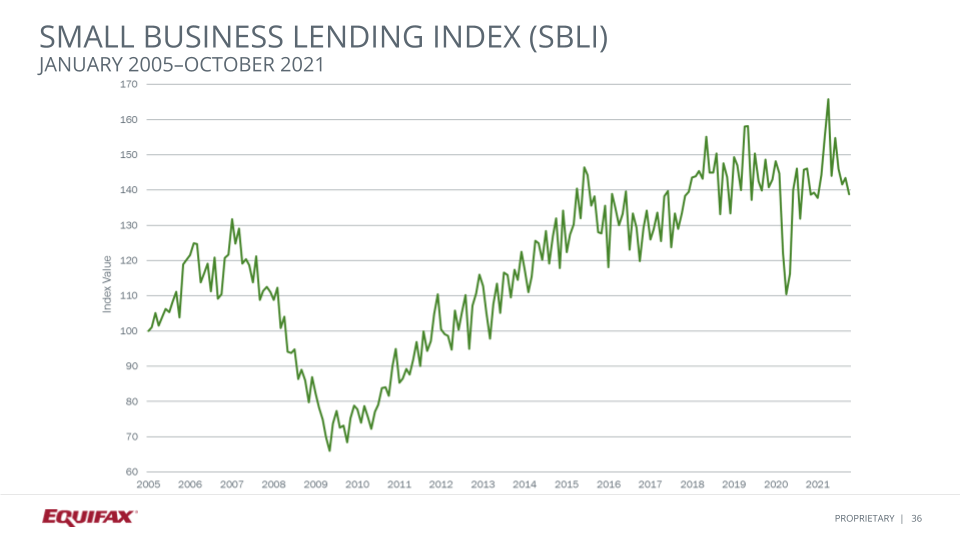
Sarah Briscoe, Lead Commercial Statistical Analyst at Equifax continued by presenting the Small Business Lending Index. The Small Business Lending Index for seasonally adjusted originations decreased 3% from 143.5 in September to 138.9 in October. Since January 2021, lending has increased slightly, but decreased from the spring 2021 highs brought from that 1 trillion dollar stimulus package. The three month rolling index has not increased since April 2021, which shows we may be seeing some slow down after the stimulus package.
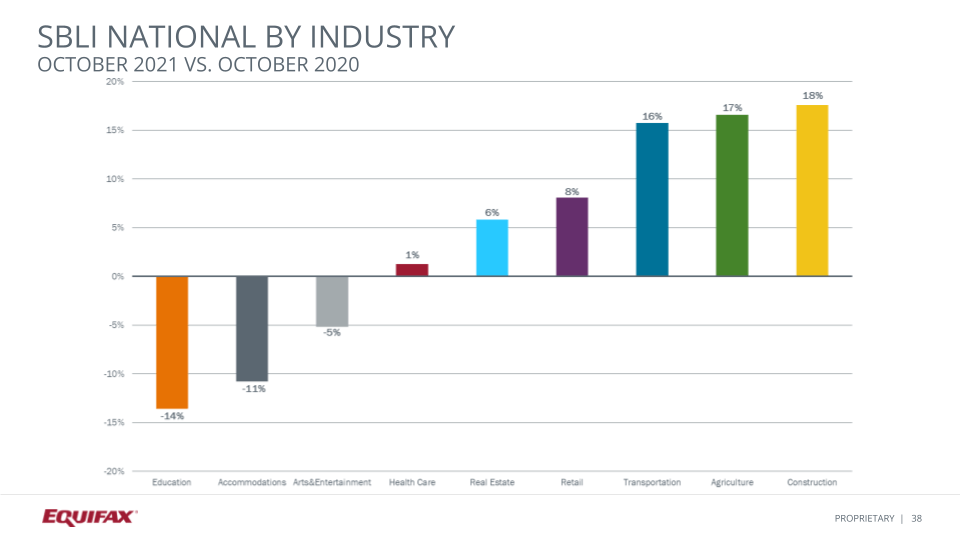
When looking at year-over-year trends by industry (shown below) we see the most improvement in lending from construction, agriculture, and transportation. Briscoe noted that agriculture and construction have increased significantly from two years ago, while some industries are still down from those levels. Some industries are seeing a significant lack of lending like education, arts, and accommodations. Our continued challenges have affected small businesses. Those industries have seen rising cost and are 25% below their pre pandemic levels.
Next, Briscoe went over the Small Business Delinquency Index. The Small Business Delinquency Index (SBDI) for the measure of 31-90 days past due increased three basis points from 1.28% in September to 1.31% in October. These are the first delinquency increases since May 2020, which reflects the difficult conditions that emerged in early 2021 for small businesses. That early 2021 paycheck protection program and renewal stimulus cash all gave small businesses a boost and decreased the delinquency, significantly, as you can see in the chart.
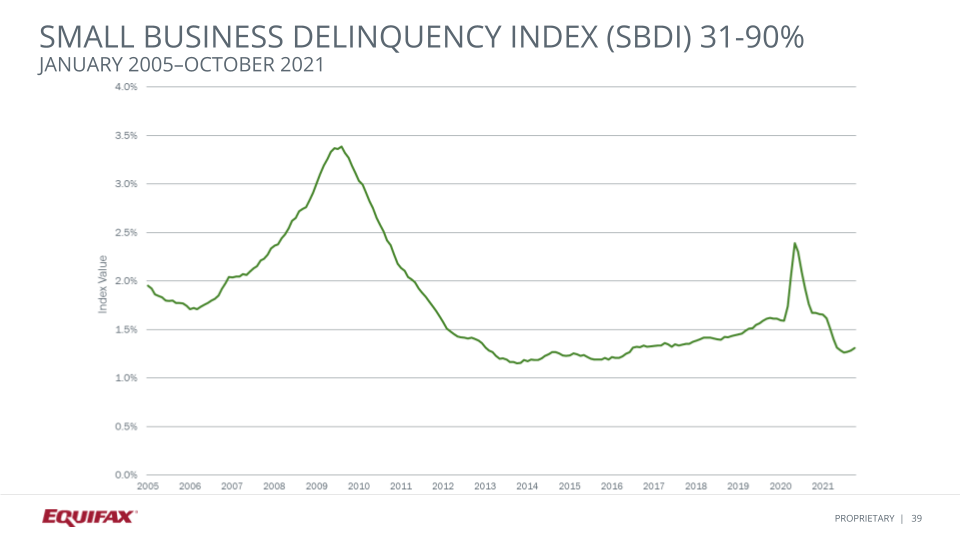
Compared to a year ago, delinquency decreased 36 basis points or 22%, and this is the eighth consecutive month of year-over-year decreases. Reflecting the overall improvement from the large delinquency increases that we saw due to the pandemic, despite that recent uptick.
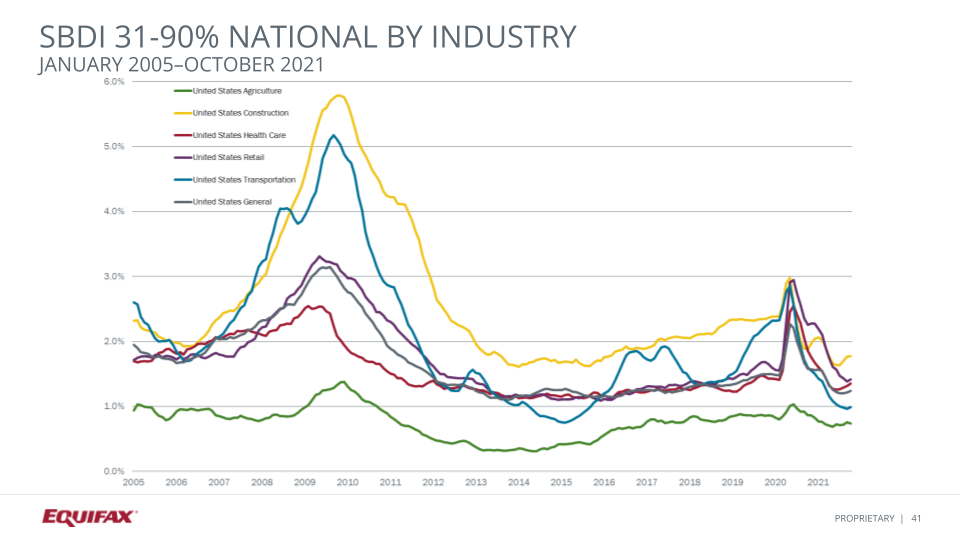
All but one industry saw a delinquency increase this month. Agriculture decreased two basis points while the remaining segments increased (shown below). Healthcare has seen four consecutive months of delinquency increases. Retail and transportation both saw their first increases in the last 10 months and 16 months respectively.
Since last year, transportation and retail industries have shown the greatest improvement in 31 to 90 day delinquency at minus 38% and minus 37%. Healthcare decreased 27% after hitting an all time high in June 2020. The other industries decreased, but in smaller amounts with construction having recovered quite quickly last year and hitting a 2020 low in October of 2020.
Click here to watch the December Market Pulse webinar for more on the current and future state of the Energy market in 2022. Access additional related insights here and register for upcoming webinars here.
* The opinions, estimates and forecasts presented herein are for general information use only. This material is based upon information that we consider to be reliable, but we do not represent that it is accurate or complete. No person should consider distribution of this material as making any representation or warranty with respect to such material and should not rely upon it as such. Equifax does not assume any liability for any loss that may result from the reliance by any person upon any such information or opinions. Such information and opinions are subject to change without notice. The opinions, estimates, forecasts, and other views published herein represent the views of the presenters as of the date indicated and do not necessarily represent the views of Equifax or its management.
Recommended for you


