What’s Next for the Post-Pandemic Small Business Economy?
In this recap of our June 3 webinar, “Market Pulse: The Post-Pandemic Small Business Economy,” Evan Leaphart, Founder and CEO of Kiddie Kredit; Robert Wescott, Founder and President at Keybridge; Sara Briscoe, Senior Statistical Analyst at Equifax; and Tom Aliff, Senior Vice President of Data Analytics and a Consulting Leader at Equifax, provide the latest economic trends for small businesses and commercial credit insights. Looking for answers to questions submitted during this webinar? Read our blog post, 6/3 Market Pulse, Your Questions Answered.
An Accelerating Recovery
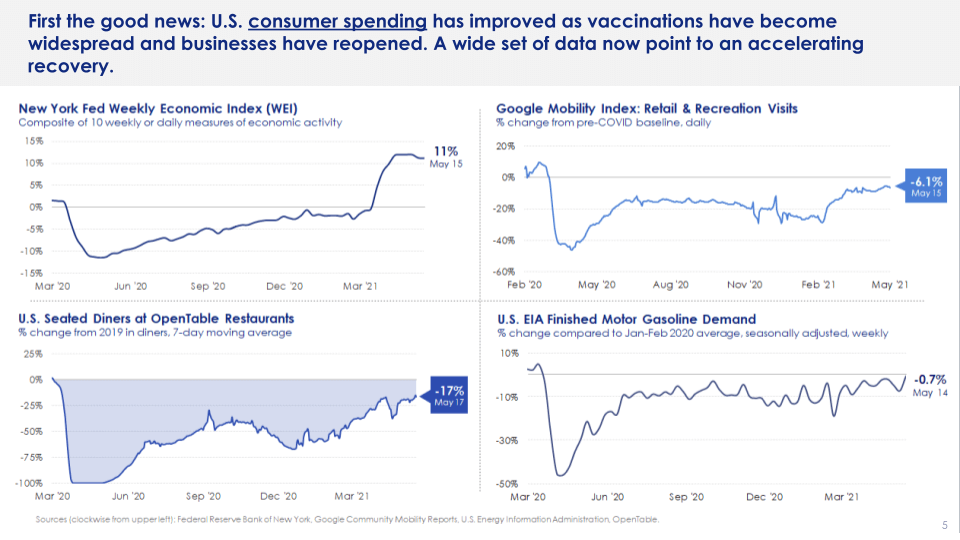
When looking at both high-frequency data and alternative data, we can get a sense of where the economy currently stands. During the webinar, Dr. Robert Wescott stated that the data of OpenTable restaurant reservations (see the bottom left of the image below) from last December, January, and even February, were 50% - 60% below the normal levels before COVID-19 hit. As for the recent months, there has been a sharp increase of OpenTable reservations. The reservations are now only down 17%.
Other data Wescott mentioned was Google Mobility data (see the top right of the image below). This data was 20% below normal throughout the last year. However, as vaccines have picked up, we have started seeing the gap close and pre-COVID levels come back. As for gasoline demand (bottom right), it was down 10% for the last year. This indicates that there has been a sharp improvement and an acceleration of the economy. People are coming out again and starting to consume.
The Post-Pandemic World
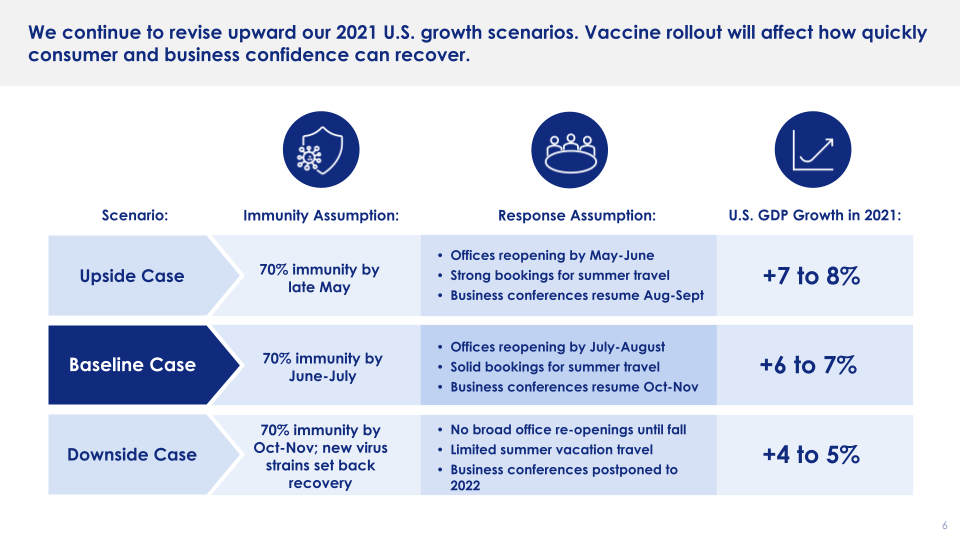
Wescott mentioned marking up the forecast for growth in 2021. The base case (shown below) is if businesses have 70% immunity by June to July, have offices reopening July to August, sell bookings for summer travel, and have business conferences in October or November. That will mean they are on track for 6% to 7% growth. According to Wescott, we are at the front edge of the base case and are moving toward the upside case. This would be a 7% to 8% growth. In this case, offices will be reopening May to June. This seems to be true, as data has shown that employees are coming back to in-person offices. Right now the economy is between the baseline case and the upside case (below). That being said, we will see around 7% growth this year. To put that in perspective, the last time we had growth at this rate Ronald Reagan was president in 1983. This is the fastest rate of economic growth in the U.S. in 40 years.
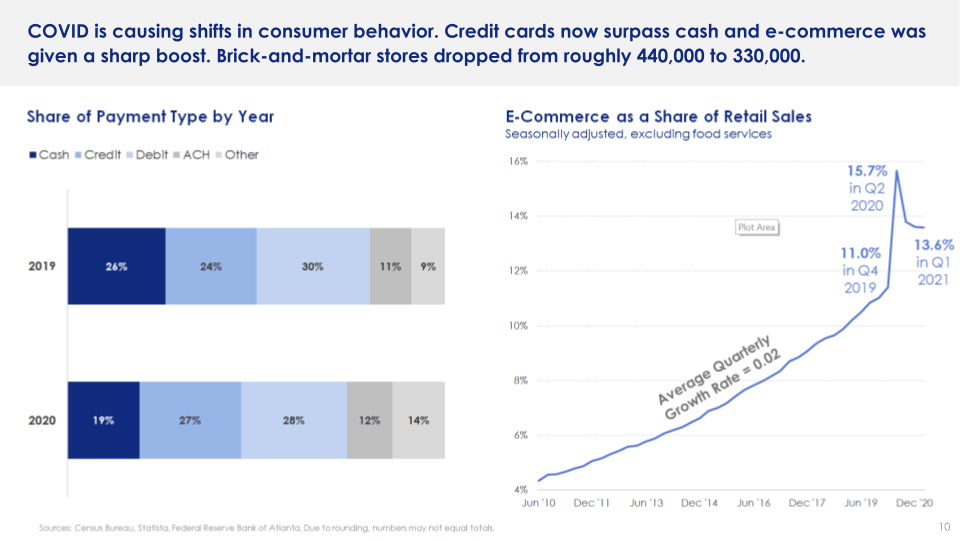
Pertaining to travel, business travel has had a 15% drop because of COVID-19. Wescott mentioned that the biggest drop in travel will be in intra-company meetings and training sessions. This is due to Zoom and other different virtual meeting platforms replacing in-person meetings. This type of drop will be permanent. COVID-19 is also causing shifts in consumer behavior. According to the chart below (left), credit cards now surpass cash. E-commerce, shown in the chart below (right), has been given a sharp boost leading to an unfortunate drop in brick-and-mortar.
Back in the 1960s
Next, Wescott mentioned inflation risk. Wescott stated, the biggest post-COVID shift is the $6 trillion fiscal stimulus check that is stoking inflation concerns. Many people compare the parallels to the 1960s and today. In this scenario, COVID-19 is comparable to the economic impact of the Vietnam war and today's American Rescue plan is the expanding safety nets that were similar to Medicare and Medicaid.
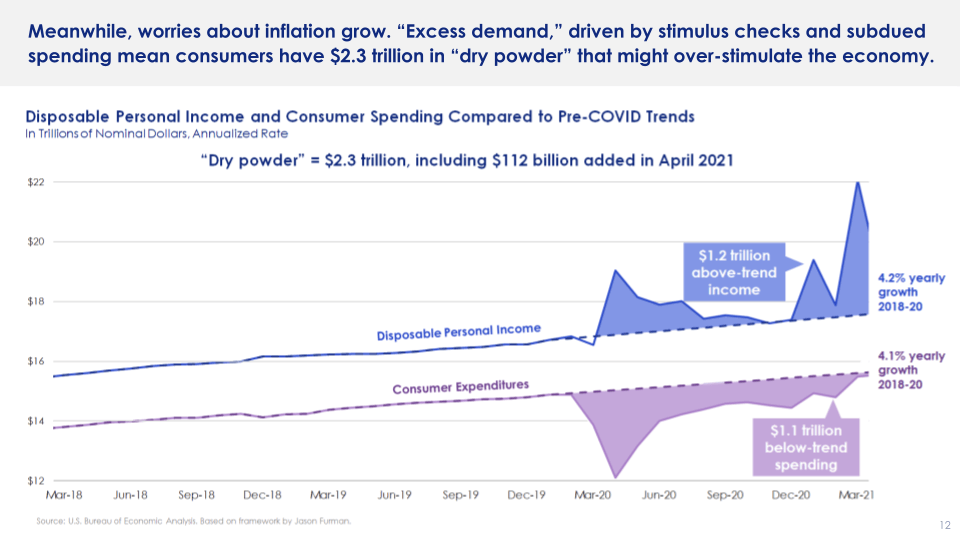
Dr. Wescott explained that in the chart (below), the purple dashed line indicates the long-term trend from 2018 - 2020, or the pre-COVID hit. Consumer spending was expected to continue to increase 4.1% a year. The blue dashed line is the disposable personal income from 2018 - 2020 with 4.2% a year. The chart also shows the actual colored lines of what really happened over the past year. Unfortunately due to COVID-19, people did not spend their money. However, the surprise was the blue solid line rising, which is due to the fiscal money that people were receiving in their checking accounts and pockets.
The real question is how fast can inflation pick up? According to Wescott, inflation can pick up quite a bit in a short amount of time. The consumer price index (left), shows inflation ran at about 1.5% a year back in the 1960s, which is similar to what has been happening over the last five years. Inflation has increased its percentage, as well as wages, and the 10 year bond, doubling from 4% to 8%.
The University of Michigan survey reported that inflation is going to run at about 4.5% over the next year. That being said, if business owners think inflation is going to rise, they will start raising prices on restaurant menus and service rates. When it comes to housing prices, the large metro areas have been seeing double digit inflation over the last year. Many major cities have been seeing 10% or greater, with some cities up 20%.
The Credit Access Research Project
The forthcoming Equifax Credit Access Research Project is data oriented, focusing on small business credit and the experiences of women and minority owned businesses before and after COVID-19. Wescott elaborated on the project, mentioning these people are about half of those employed in the U.S. economy and about half of GDP. Small businesses are a big part of the economy and have recently been challenged. Small businesses have gone from thriving to surviving the pandemic. Now is the time to help these small businesses with the Equifax Credit Access Research Project.
More Chores, Better Credit Score

Next, Evan Leaphart, founder and CEO of Kiddie Kredit, went over his company and why it was important for him to bring Kiddie Kredit into this world. Kiddie Kredit is a chore tracking app that teaches kids about credit. The better a kid does its chores, the better its credit score. Leaphart mentioned he was always affected by credit. Being an entrepreneur his whole life, Leaphart found it difficult to get access to a business loan or line of credit. Knowing there are a lot of entrepreneurs out there led him to the idea of Kiddie Kredit. Leaphart indicated the importance of the app and how it helps children learn about credit and loans before they start a business of their own. Being CEO and founder of Kiddie Kredit during a pandemic has had its challenges for Leaphart. Leaphart stated that there is now more of a collaborative process between parents and schools. Kiddie Kredit’s goal is to help bridge the gap and help make the process more collaborative for everyone involved.
Time for Small Businesses
When it comes to the equitable economic recovery, Leaphart indicated that it is multifaceted. On one end there are retail investors that have enjoyed the pandemic. But, on the other end are other individuals, especially in the hospitality sector, that have had a hard time during the pandemic. Going forward, Leaphart suggested there will need to be a lot of support in the form of loans when it comes to helping small businesses.
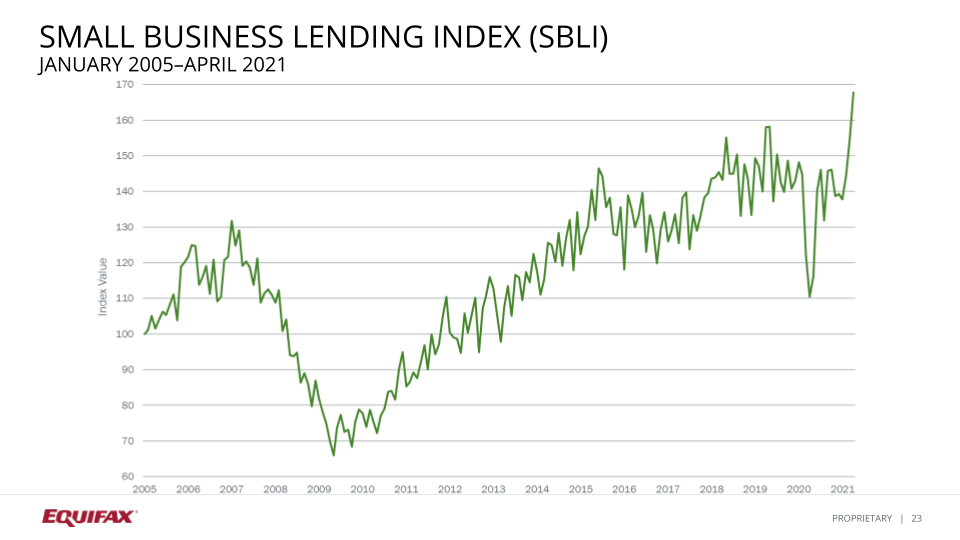
Sarah Briscoe, Senior Statistical Analyst at Equifax, reported that the small business lending index seasonally adjusted originations across the nation (below) increased 9% from 154.6 in March to 167.7 in April. Compared to April 2020, the index is up 52% (below). April 2020 was the low point of the index after the start of the pandemic. The rolling three-month index, for the last three months, is at 155.5 and it's up 24% compared to last year. And again, up 7% compared to last month.
Small Business by Industry and State
When looking by industry, the 12 month rolling lending index showed improvement for a number of industries. However, construction showed the best improvement. Construction is up 21% year-over-year, followed by administrative, support, and waste management services, which are up 16%. Briscoe continued to report that agriculture is up 16%, followed by transportation up 12%. However, some industries are still suffering. Accommodations and food services are at negative 35% year-over-year, still suffering in hotel and restaurant businesses.
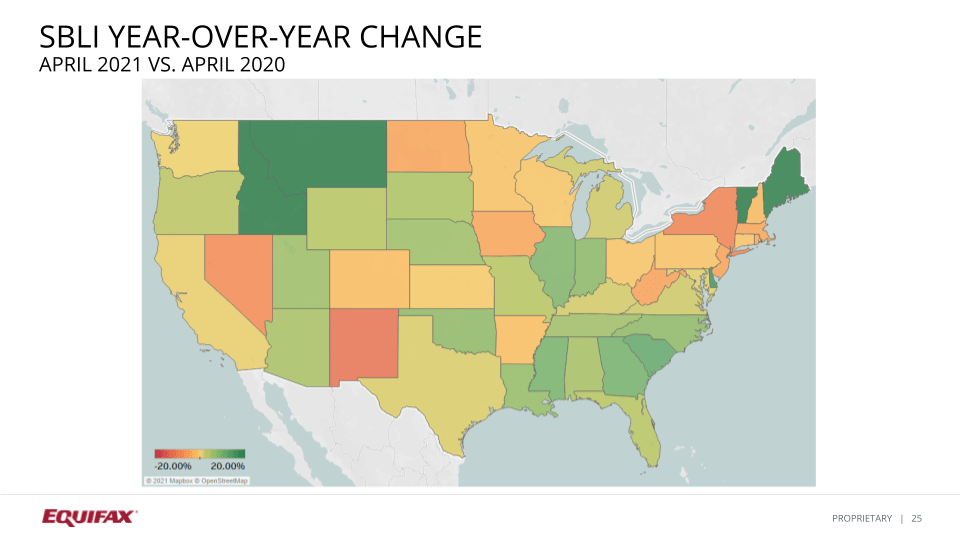
Also, arts and entertainment is at minus 27% year-over-year. Although those decreases have slowed down since approaching April, we are still seeing some slight improvement. Briscoe stated she is optimistic on having more improvement in those industries in the future. Next, Briscoe reviewed the lending activity by state (below). Most states are seeing recovery year-over-year. Lending is up in Southern states as well as parts of the Northwest and New England areas. However, lending remains down year-over-year in New York, New Jersey, Nevada, New Mexico, and West Virginia.
Small Business 31-90 Days Past Due Delinquency Rate
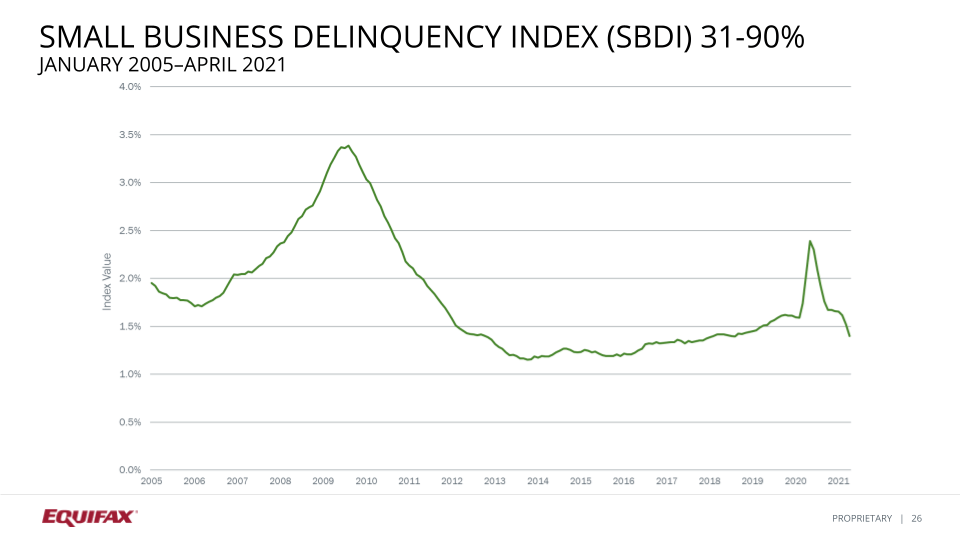
Briscoe reported, for the small business delinquency index in the overall U.S. for the metric of 31 to 90 days past due, that the index decreased from 1.52% in March to 1.4% in April. This is the fifth consecutive month of decreases for the index. However, this is the first time the index is dipping below the levels we witnessed in 2019. In the graph (below), compared to last year, the 31 to 90 days past due delinquency rate decreased 67 basis points, or 32%. The 2021 improvements are the first time the index has decreased year-over-year since 2015.
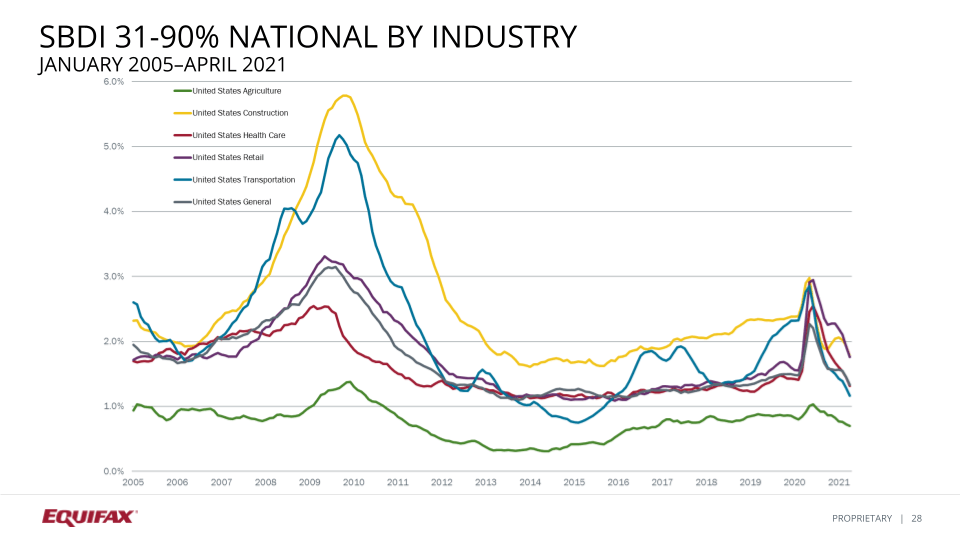
The chart (below) shows great improvement by industries at 31 to 90 day delinquency. This is the third consecutive month that all industries had a decrease. Retail and construction had the largest decrease at minus 16 basis points. Healthcare was lower at 13 basis points, transportation in general at 12 points and agriculture at three.
Small Business 91-180 Past Due Delinquency Rate
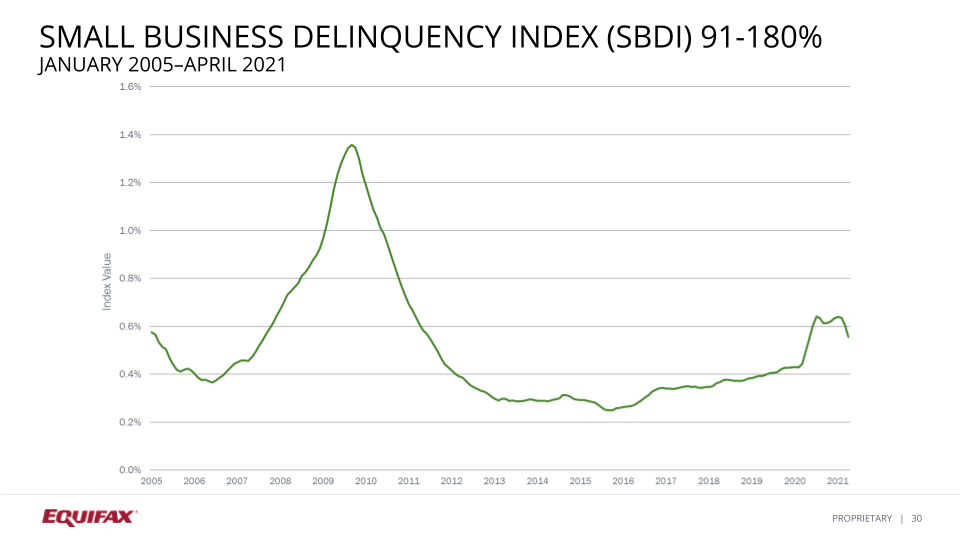
Briscoe reported from the chart (below), that the national small business delinquency index at the metric of 91 to 180 days past due also decreased for April by four basis points. However, even though it has improved over the last few months, the index remains at levels last seen in 2011. Unlike the 31 to 90 day delinquency index, there are elevated rates due to the pandemic at the 90 to 180 days past due. That being said, there is a lot of cash flowing in and the lighter delinquency rates are going out faster than the more severe 91-180 delinquency.
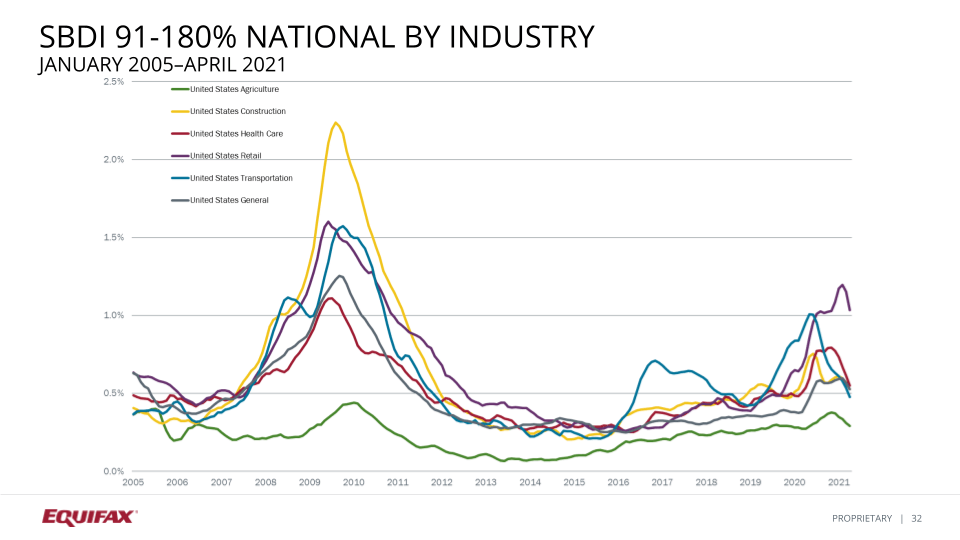
Next, Briscoe explained the industries at 91 to 180 days past due delinquency index. The index is up 13% from a year ago. Even though it has increased from a year ago, it is the smallest year-over-year increase since early 2020. According to Briscoe, all segments saw a decrease in delinquency month-over-month. Transportation and construction have seen the most improvement over 2020 levels. Transportation is down 50% year-over-year and construction is down 21% year-over-year.
When looking at the graph (below), Briscoe indicated that the purple line is the retail and restaurant segment. This is the most elevated it has been, at a 40% increase, compared to April 2020. Even though retail has improved for the past two consecutive months, the 91 to 180 day delinquency rate is almost double that of the next highest, which is the red line (below) at healthcare.
Time to Spend
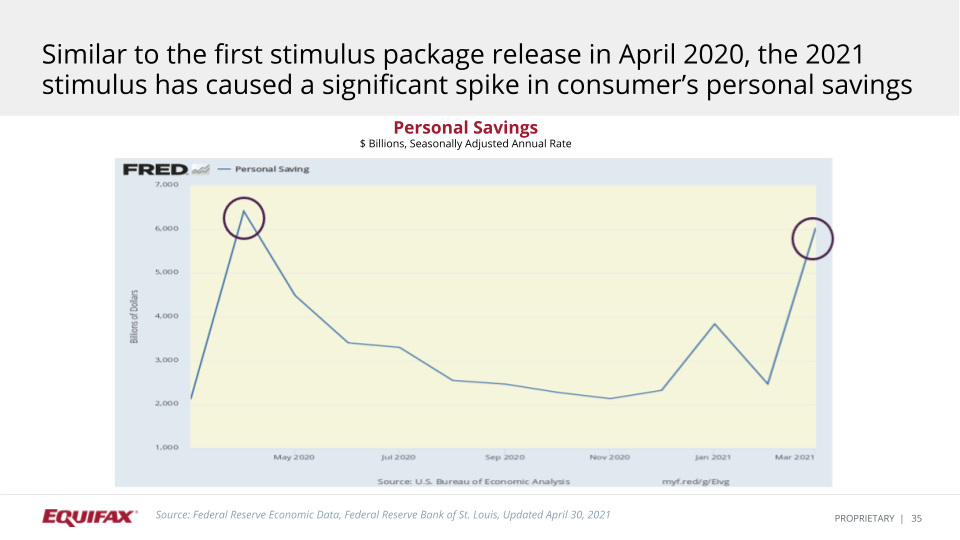
In the last part of the webinar, Tom Aliff, Senior Vice President of Data Analytics and a Consulting Leader at Equifax, went over the consumer credit trends. According to Aliff, the personal savings that have happened since the second stimulus package have started to pad consumer bank accounts again. Compared to last year, when we saw an uptick at the first circle (below), from a personal saving standpoint, we can compare it to the circle on the right, where we see an uptick due to the stimulus package. This sets up the nation starting to open up more around the Memorial Day holiday and consumers getting ready to spend their cash.
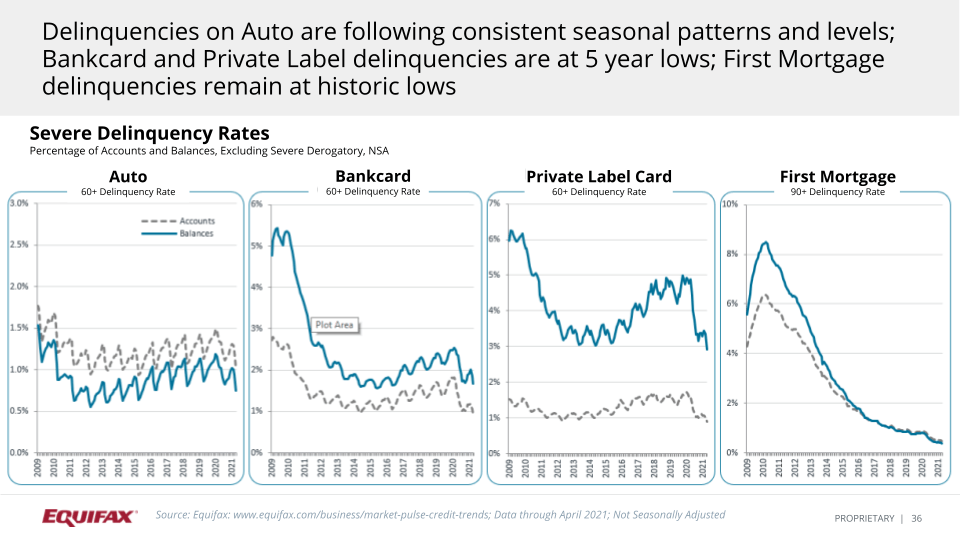
The delinquency levels (below) for automotive, bankcard, private label, and first mortgage show that consumers are ready to spend. The reduction in delinquency can be seen across most of the major business lines.
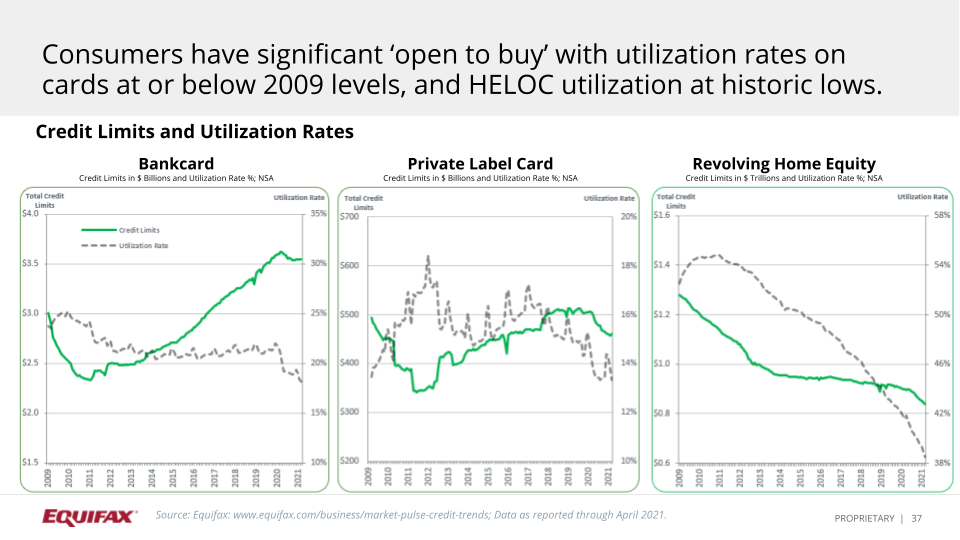
Lenders will need to provide compelling offers to consumers. Aliff indicated that the dotted line (below) shows that utilization on bankcard, private label, and equity are all down. And, the green line represents the assigned credit limits. Looking at the current lines on the bank card and private label side, they have all increased throughout most of the last 10 years. However, there was a dip in the 2020 timeframe. With utilization being low and credit lines being slightly low, there is still a bit of room to buy. There is some available credit for consumers once they become more comfortable with traveling and other activities they were not able to do in 2020.
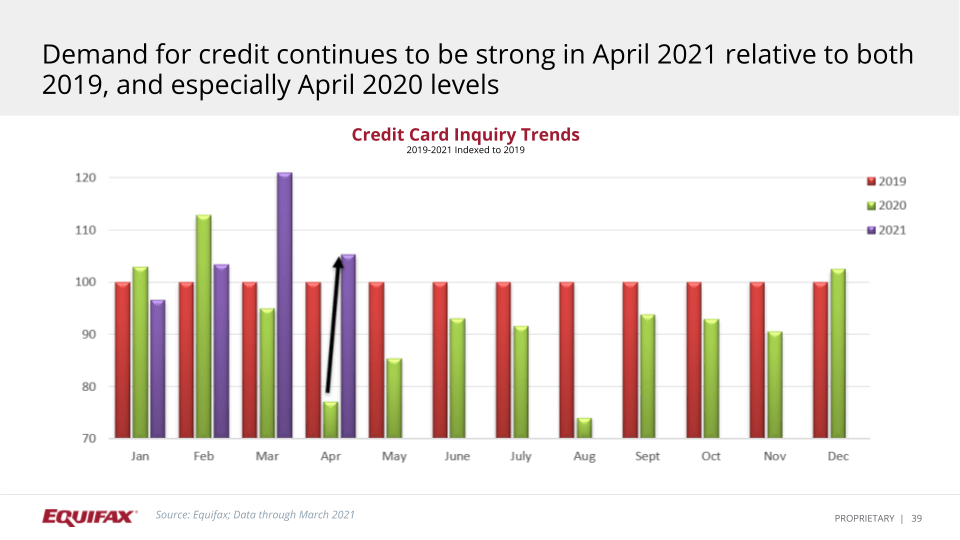
Last, Aliff mentioned that the large reduction in delinquencies and utilization during the pandemic caused a shift in consumer score distributions to higher score levels. However, when looking at credit card inquiry trends (below), demand for credit continued to be strong in April 2021 relative to both 2019, and especially in April 2020 levels.
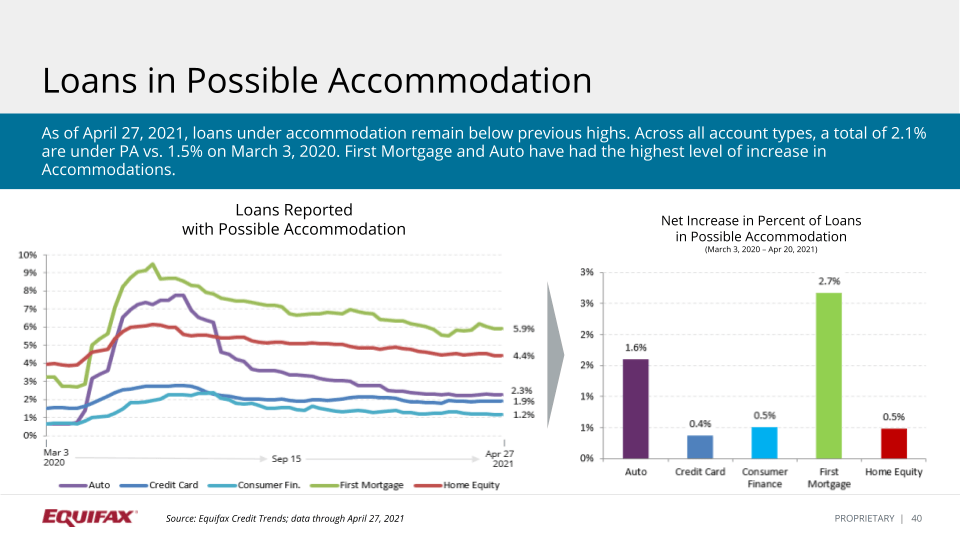
When it comes to accommodation levels, first mortgage and equity are still slightly elevated (below). Aliff reported there was a slight drop off in auto and some reduction in the consumer finance perspective and credit card. Aliff concluded by mentioning the importance of actively monitoring and considering the first mortgage profiles. He also mentioned it is important when it comes to home equity, since that is often the consumer’s biggest payment every month.
The full webinar recording can be accessed by visiting Market Pulse: The Post-Pandemic Small Business Economy , and you can download a copy of the presentation slides here .
And, if you would like to speak to an Equifax representative about any of the data or solutions mentioned in this blog, please contact us today .
Recommended for you

