The U.S. Economy and Consumer Wealth in 2021
This is a recap of the April 1 webinar, Market Pulse: The Tide is Turning. We are sharing key insights on the U.S. economy and consumer wealth offered from Amy Crews Cutts, President and Chief Economist at AC Cutts & Associates; and Ian Wright, Chief Data Officer for Data-driven Marketing at Equifax.
Lessons from the Financial Crisis and Great Recession
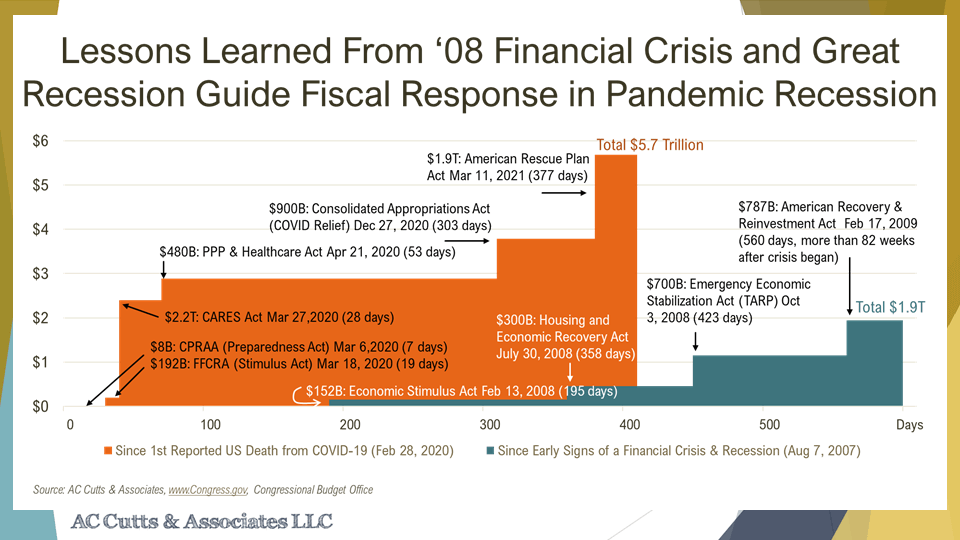
Lessons learned from the 2008 Financial Crisis and Great Recession have led to a more timely and robust fiscal stimulus-response to the current pandemic recession. This was highlighted by the combined $5.7 trillion stimulus passed within 377 days from the pandemic start versus the ‘08 $1.9 trillion support rolled out 82 weeks from when the crisis began. The image below further breaks down the stimulus packages and rollout dates.
The recent recession is being met with a more aggressive response plan and is aimed to cut off larger financial decline. Amy Crews Cutts explained that this helped keep impacts to the GDP relatively benign. Cutts noted that despite initial debate, the $1.9 trillion American Rescue Plan was the right amount.
Inflation and Interest Rates Will Likely Increase, But Not Too Severely
Even with the positive impacts of the stimulus, there is still speculation and uncertainty around how the economy will respond in the long term, with fear of inflation as a likely result. Cutts noted that she does not believe the latest roll out will lead to inflation. But, because macroeconomics has small sample sizes, which unfold over long periods, and fortunately recessions or global pandemics aren't frequent, economists are leaning into theories to predict what is next.
The chart below (left) shows the Consumer Price Index measure and periods of severe inflation and deflation in the U.S. Starting in 1948 a big increase in inflation, driven by post-war expansion, was followed by the Federal Reserve’s strict consumer lending rules. This unintentionally led to a mass deflation. The next big impact came in 1970 with the Arab oil embargo and delinking the dollar from the gold standard. However, since the 1990’s when the U.S. aided the Kuwaitis in the Iraq Kuwait War, inflation has been more steady without major impacts, and Cutts explained it is not as big of a risk to the economy.
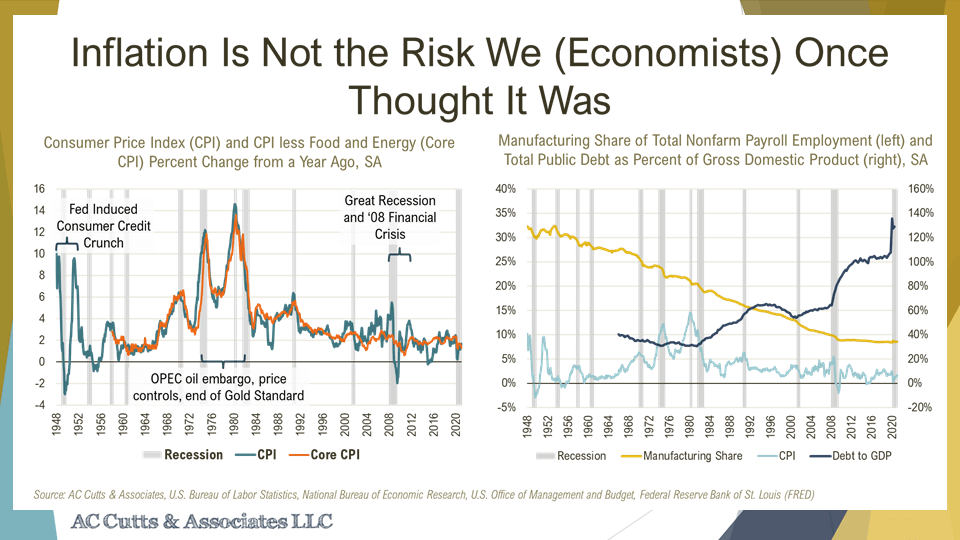
Another theory for the reason that inflation has remained even is that the U.S. is no longer a manufacturing economy. The U.S. has moved into being a service-based economy. The chart above (right) shows that manufacturing as a share of employment has gone down. The federal national debt as a fraction of the Gross Domestic Product (GDP) has gone up and inflation has remained benign. Cutts explained that she doesn’t believe that the U.S. will see a big bump in inflation. Nonetheless, it may be possible that we exceed the 2% threshold. Chairman Powell of the Federal Reserve has said that inflation may go above 2% for a short period, but will still average around 2%. Overall, Cutts believes that regaining full employment is the more important current mandate. However, Cutts believes people are closely monitoring inflation.
Interest rates are similarly to inflation, having a steady progression. Although Cutts explained that she does believe the U.S. will see rising interest rates, they are unlikely to increase very sharply in the near term. Interest rates are rising but from record lows. Currently, interest rates on 10 year Treasuries saw an increase and are back up to around 165, close to where the U.S. was a year ago.
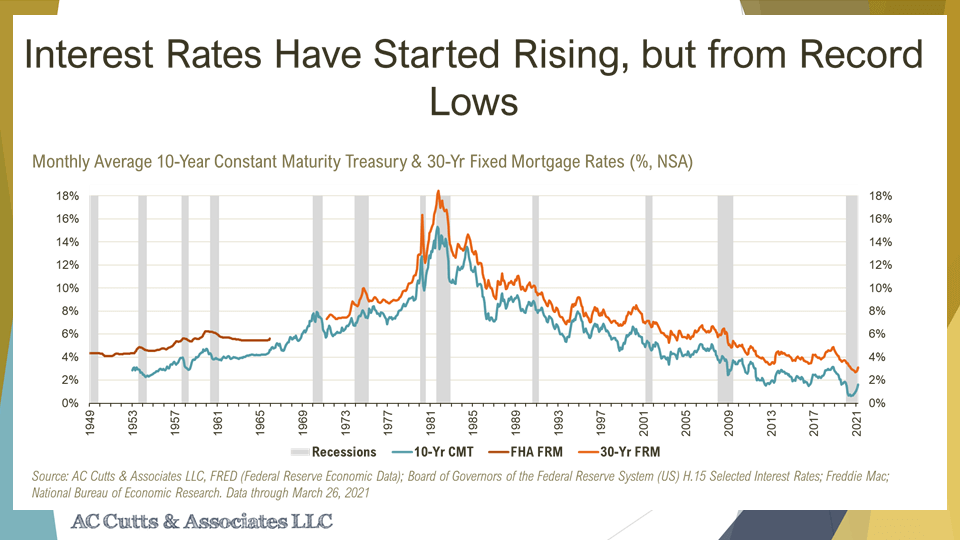
Mortgage rates have also risen, although to a lesser degree as lenders compete for the last bit of refinance business. Treasury bills and bonds are still seeing very low-interest rates affecting things like consumer rates of return on deposits. Cutts further explained that the bond market is not forecasting inflation. This is likely due to the Federal 2% bond on inflation. That being said, a more robust and sustained economic growth is expected.
Household Financial Stability is Good, Pointing to Low Risk
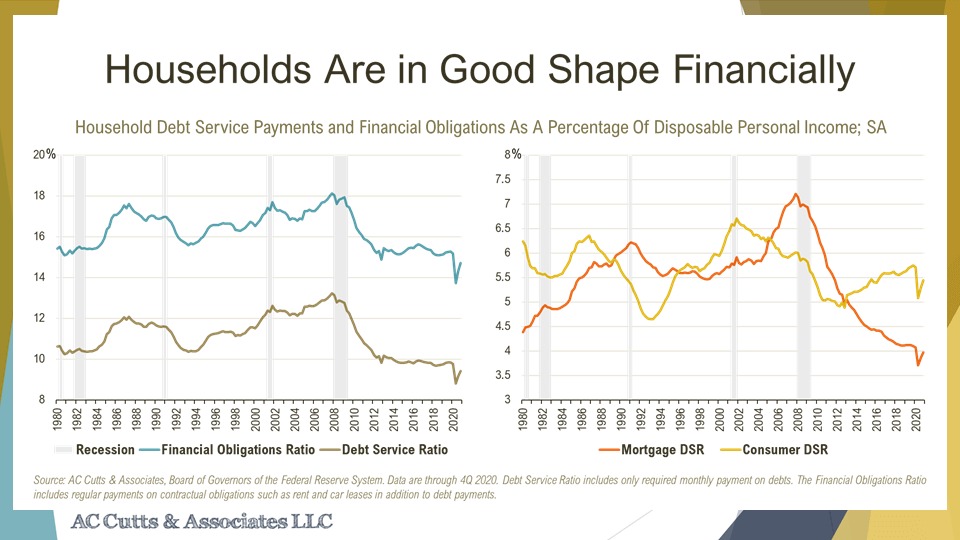
Times of financial uncertainty mean understanding how financially stable households are. The Federal Reserve looks at household financial stability in two ways. The first way is the debt service ratio which examines the required monthly credit payments of households including all credit card, auto loan and mortgage payments.
The second is the financial obligations ratio. This includes contractual obligations to pay for things like rent and car leases, as well as other long-term obligations. All of these household financial obligations measures are currently down. This is a sign that U.S. households are in good financial shape. There is no reason to expect a rise in credit risk beyond what is already baked into existing underwriting models.
Household Wealth Increased and Mortgage Default Risk is Low
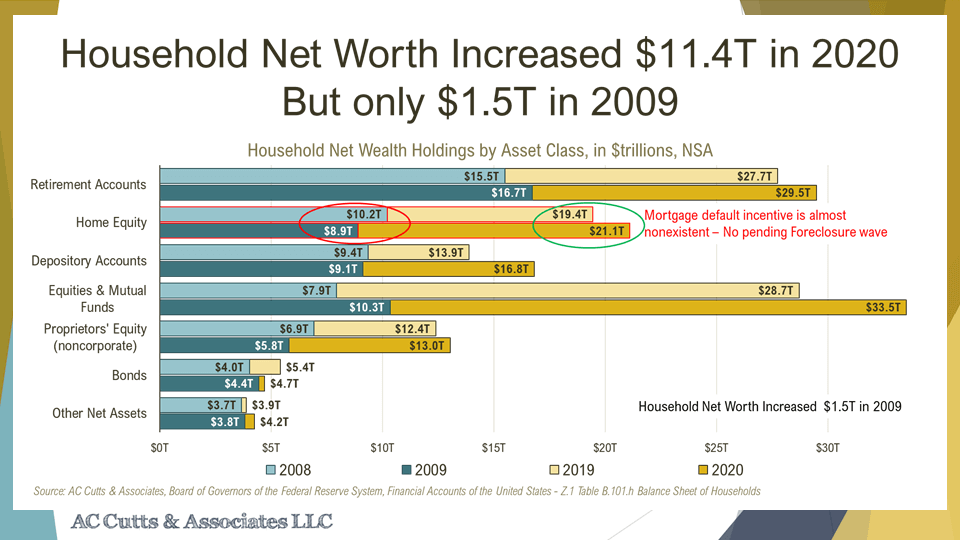
Household wealth also saw growth in the face of pandemic economic impacts. Wealth showed an overall increase of $11.4 trillion in net worth last year. Home equity increased by almost $2 trillion. This is a major contrast to the 2008 recession. The image below outlines the decline in home equity that happened in 2008 due to the falling home prices compared to the current increase. This created the meltdown of the mortgage and secondary market financing that nearly caused a global financial collapse and drove a $1 trillion home equity decrease. Cutts explained that this takes away default incentive. Even though it is not ideal, households with equity in their home can sell, providing them with a financial cushion if necessary. This leads to a better outcome than going into foreclosure.
Consumer Spending Likely to Rise
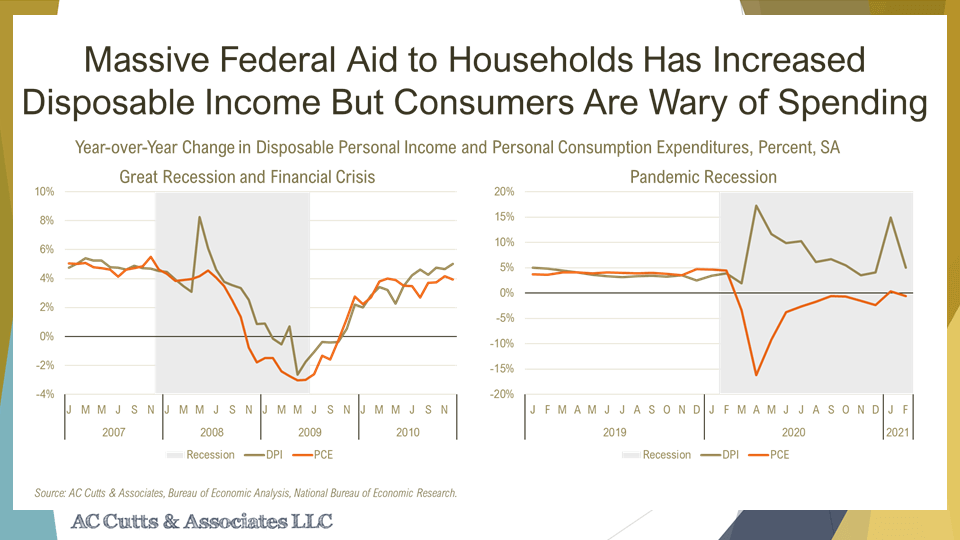
U.S. consumers increased their disposable personal income (DPI), which consists of wages, salaries, government transfers, social security and Medicare. Personal consumption expenditures (PCE) decreased as consumers pulled back on spending as a result of business shutdowns and travel restrictions. The image below compares DPI (in brown) versus PCE (in orange). The chart on the left shows that the outcome during the great recession was that both were down, pointing to a lack of funds and decreased spending. The chart on the right shows present times with DPI way up and PCE way down last year. However, in 2021 DPI is still up and PCE has almost come back to last year's levels. Cutts, predicts that the U.S. economy will see some pent-up consumption as vaccine distribution continues.
U.S. Wealth Grew, But Not Equally for All Consumers
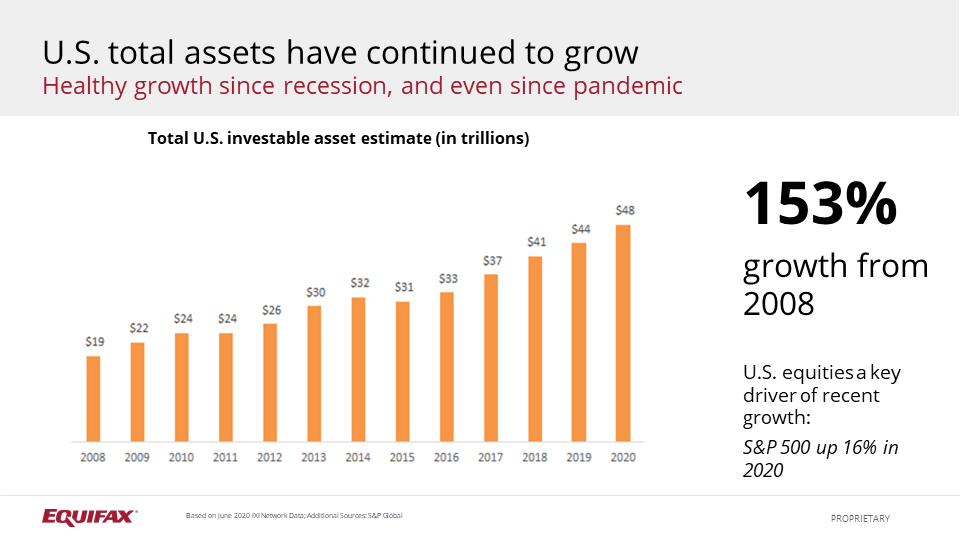
Ian Wright further elaborated on the state of the U.S. consumer wealth citing the Wealth Trends 2021 annual report by Equifax which found that overall total assets grew by $4 trillion from 2019 to 2020. As shown in the chart below, since 2008 the U.S. has seen record level consumer wealth growth. Consumer wealth has increased 153% in the last 12 years.
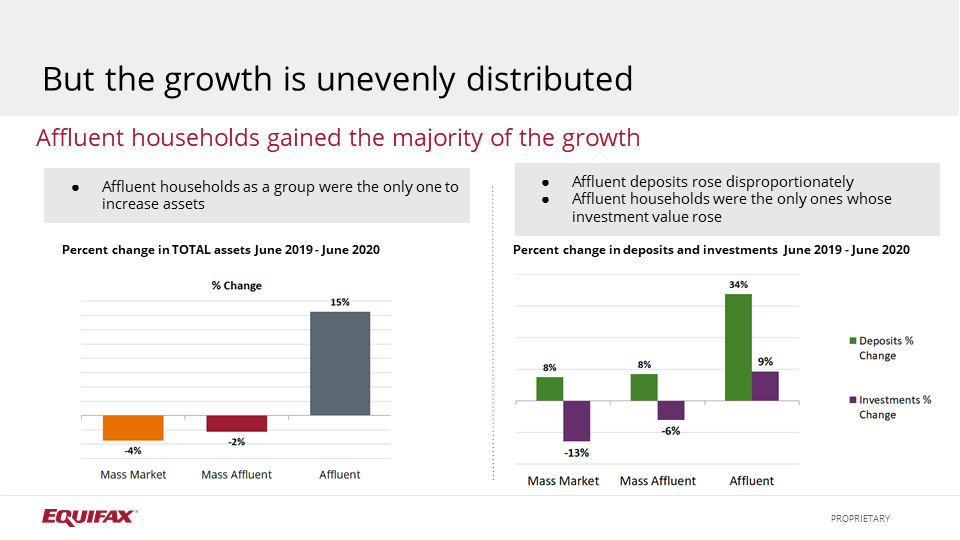
Despite the overall growth, Wright echoed what economists already have stressed. The recovery does not look the same for all U.S. consumers. The U.S. is in a K-shaped recovery. Those at the top of the K have seen a financial increase during the recession, while those at the bottom half have experienced decline. This can be seen in the chart below (left) by the change in total assets which declined for the mass market and mass affluent but grew for the affluent. The mass market is defined as households with less than $100K in overall wealth, mass affluent is households with $500K-$1M in assets, and affluent is households with $1M+ in investments.
The chart (right) shows the percent change in deposits and investments. While, mass market and mass affluent grew their deposits, their investments declined. Affluent households were able to seize the stock market. Affluent households saw a 34% growth in deposits and a 9% growth in their investments.
Wealth Growth Differs by Generation and Wealth Gap Continues to Grow
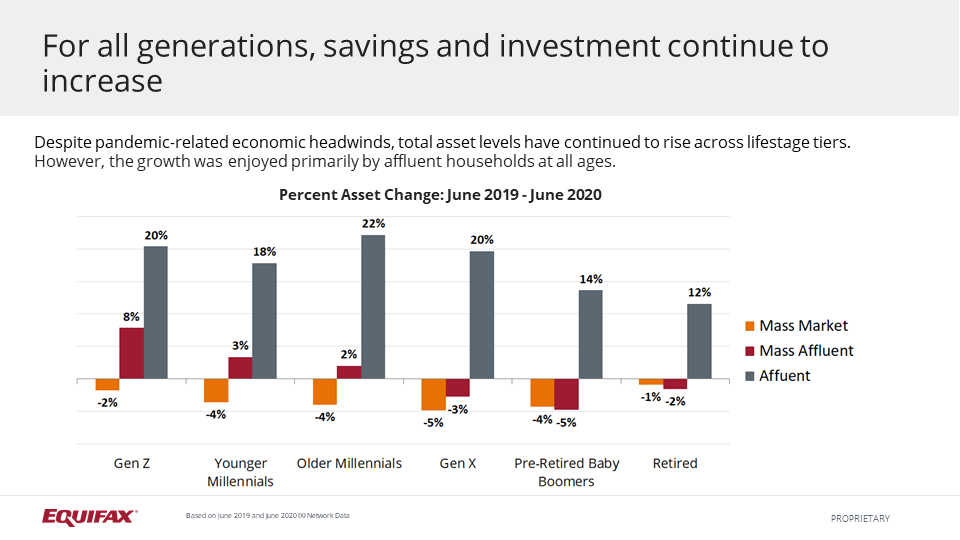
The chart below further breaks down percent asset change from June 2019 - June 2020 by generations. It shows that savings and investments continue to increase even with the pandemic across all life stages. However, affluent households have experienced growth. Older millennials (37-47 years old) in the affluent bucket saw the most growth of 22%. This follows a tie between affluent Generation Z and Generation X households who grew their assets by 20%. All told, the pre-retirement Baby Boomers and the retired generation had the most overall total wealth growth. They continue to hold the lion’s share of all wealth in the U.S.
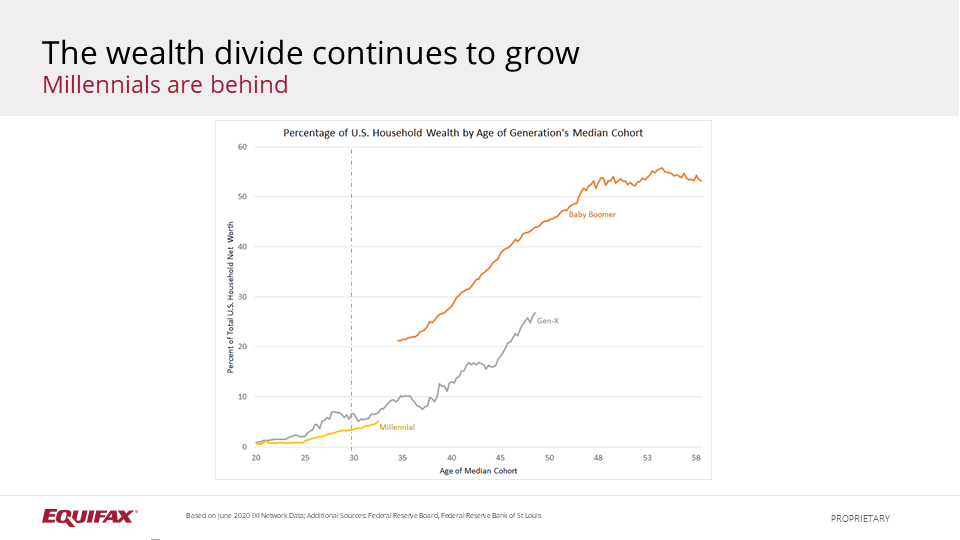
Breaking up households by percent of overall wealth over time and age shows that the wealth gap continues to grow. Baby Boomers (orange) held 22% of all U.S. wealth when they reached the median age of 35 in 1990. Also, Baby Boomers continue to see significant growth in their share of wealth. Generation X (gray) hit their median age of 35 in 2007 and held just 11% share of wealth. Even though this is half of what Baby Boomers had at the same age, Generation X is still doing fairly well. However, Millennials (yellow) are projected to be even more behind historically when they hit the median age of 35. Millennials are even further behind after COVID-19 despite the financial aid of the stimulus payments.
Find Opportunities in Consumers with High Financial Durability
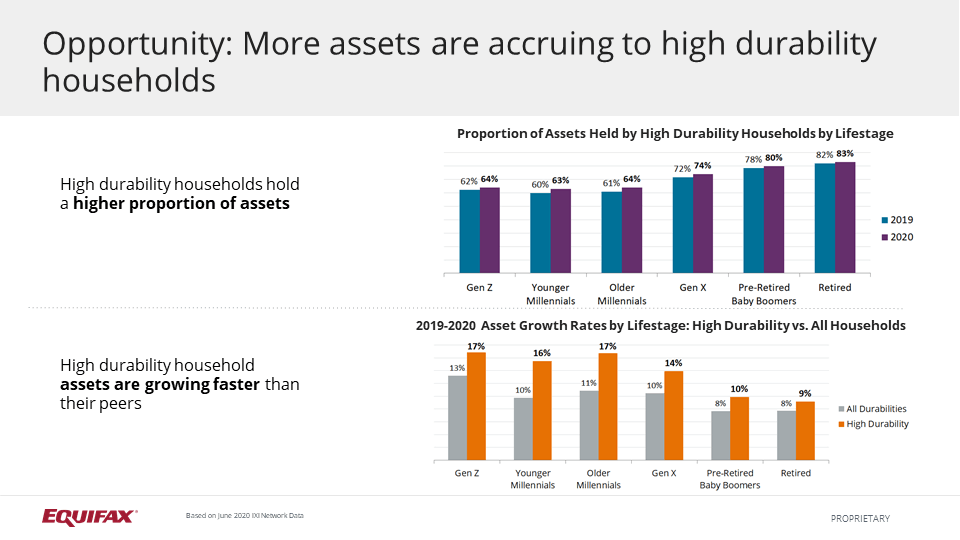
Understanding financial capacity can help businesses appropriately respond to pent-up consumer demand and better engage with customers through the recovery. To do this even more effectively, businesses need to identify pockets of opportunity growth while navigating hidden risk. Seeking out financially durable households can help. Consumers who are high opportunity are financially durable. These types of consumers can meet their financial obligations and grow their wealth and thus are lower risk to businesses. The chart below shows that households with high durability held a higher proportion of assets. They grew their assets across all life stages faster than their low durability counterparts.
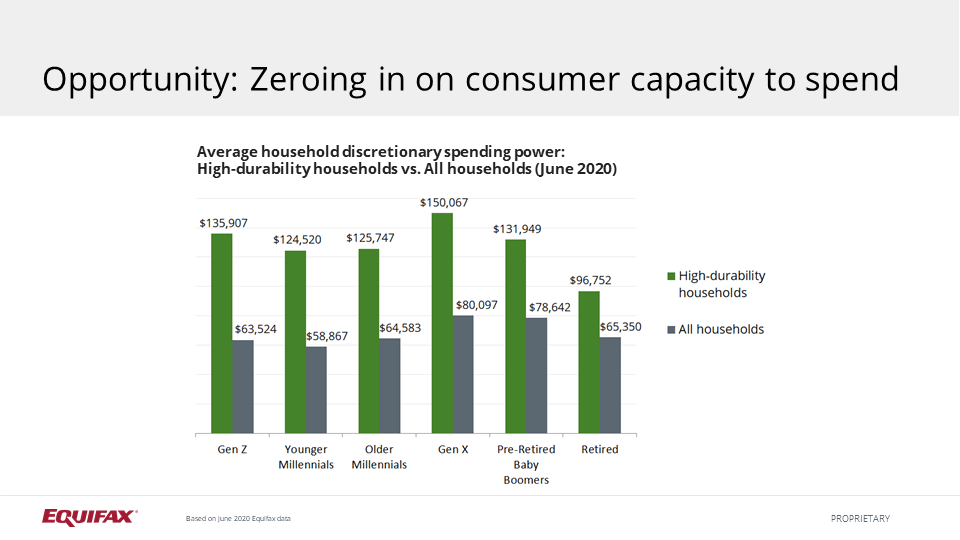
Also, high-durability households at all generations have higher than average spending. On average they have a 86% higher spending capacity overall. For younger age cohorts the spending capacity is even higher, 114% for Generation Z and 112% for young millennials. Finding and targeting these households can be a strategic move for businesses looking for opportunities of growth and risk mitigation. Financial Durability Digital Targeting Segments can help businesses strategically target households with varying resilience to handle adverse financial situations, including COVID-19 economic stress. Also, use Income360 to improve performance for both direct marketing and online targeting by gaining more complete estimates of household income.
To learn more, check out the full webinar recording by visiting Market Pulse: The Tide is Turning or download a copy of the presentation slides here. Our team of experts answered many questions submitted by attendees during this webinar in a follow-up blog post, April Market Pulse - Your Questions Answered.
If you would like to speak to an Equifax representative about any of the data or solutions mentioned in this blog, please contact us today.
Recommended for you


